Decoding Candlestick Patterns in Crypto Trading: A Blockchain Market Guide
Table of Contents
Introduction
Financial markets have always relied on visual tools to help traders interpret trends. Among the most powerful of these tools are candlestick patterns, which originated in Japan centuries ago and remain central to stock market analysis today. In the blockchain era, where cryptocurrencies trade 24/7 and volatility is the norm, candlestick analysis is more relevant than ever.
This blog explores how candlestick patterns can guide trading decisions in blockchain-based markets and why they are crucial for navigating today’s digital asset ecosystem.
What Are Candlestick Patterns?
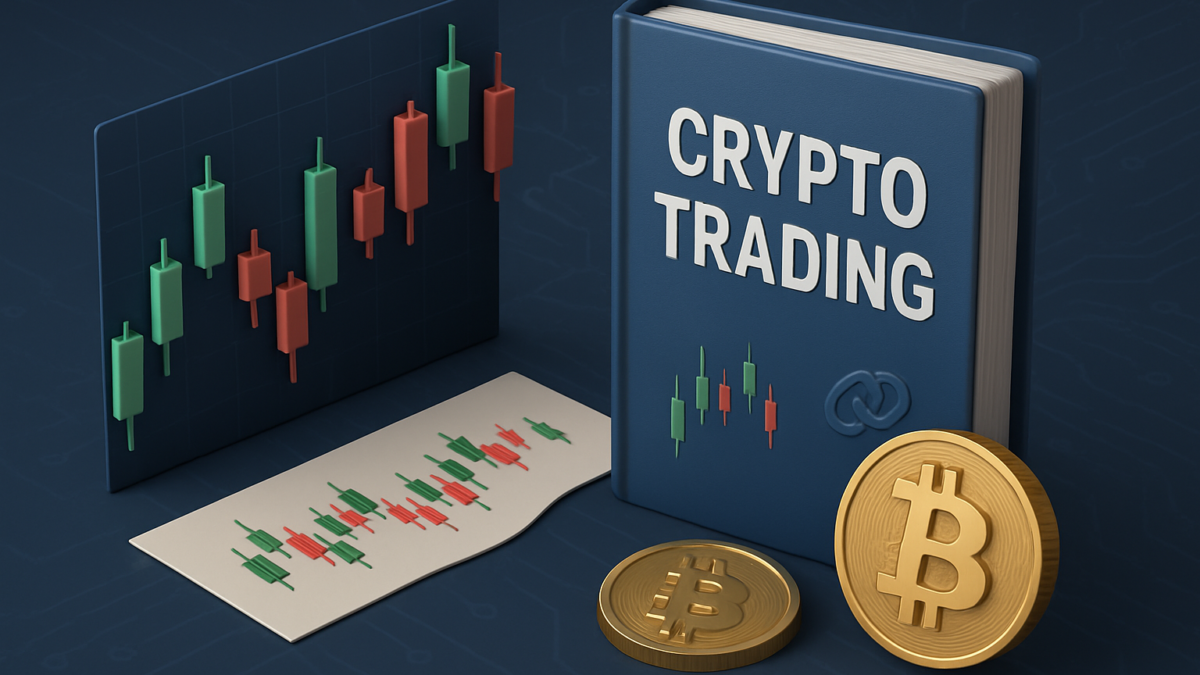
Candlestick charts represent price movements in a given timeframe. Each candle shows four key data points: open, high, low, and close. Over time, repeated formations create recognizable patterns that signal shifts in market sentiment.
- Bullish patterns suggest prices may rise.
- Bearish patterns warn of potential declines.
- Neutral patterns indicate uncertainty.
These signals help traders make decisions about buying, selling, or holding assets.
Why Candlesticks Matter in Blockchain Markets
Unlike traditional stock exchanges with set trading hours, crypto markets operate 24/7. This constant activity makes candlestick signals even more powerful. For blockchain traders, candlestick patterns help:
- Detect potential reversals during sharp price swings.
- Understand sentiment in highly volatile altcoins.
- Reduce risk by spotting overbought or oversold conditions.
In crypto, where sudden spikes or crashes are common, candlestick analysis acts as a first line of defense.
Top Candlestick Patterns for Crypto Traders
Doji – The Sign of Indecision
In markets like Bitcoin and Ethereum, a Doji candle (where open and close prices are nearly the same) highlights indecision. In blockchain ecosystems, a Doji often appears before major announcements or hard forks.
Hammer – A Reversal Signal
A hammer forms after a downtrend, showing that buyers stepped in despite selling pressure. Altcoins often display hammer candles when communities announce upgrades or partnerships.
Engulfing Pattern – Momentum Shift
A bullish engulfing pattern occurs when a larger green candle completely covers the previous red candle. In blockchain markets, this often signals renewed confidence after bearish sentiment.
Challenges in Blockchain Candlestick Analysis
While candlesticks are useful, blockchain markets add unique complexities:
- Market manipulation: Pump-and-dump schemes can distort patterns.
- Liquidity issues: Small-cap tokens may show false signals due to thin trading volumes.
- Bot trading: Automated trading can exaggerate certain candlestick formations.
That’s why combining candlestick analysis with on-chain metrics (like wallet activity and transaction volume) creates a more reliable strategy.
Combining Candlesticks with On-Chain Data
Blockchain offers transparency unmatched in traditional markets. By pairing candlestick patterns with on-chain data such as whale movements, staking activity, or DeFi liquidity shifts—traders gain a fuller picture. This hybrid approach reduces false positives and improves accuracy.
Conclusion
Candlestick patterns remain a timeless tool, but in blockchain markets, they must be adapted for a 24/7, highly volatile environment. Traders who combine traditional analysis with blockchain’s unique transparency will have an edge in navigating digital asset opportunities.
You May Also Like: Top 10 Gaming Cryptocurrencies to Watch in 2025


